
By: Hailey Farrow, Marketing Manager at CostQuest.
Maximize broadband funding with granular mapping
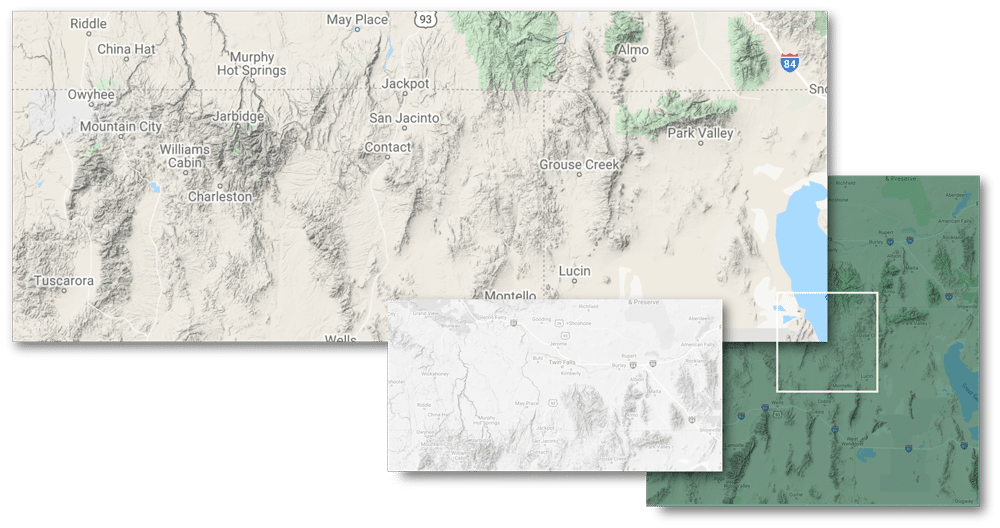
With federal and state funding rolling out to expand broadband infrastructure, the time for governments, service providers, engineers, and other related organizations to develop a granular broadband map is now. A granular broadband map displays locations below the census block level, using structure-level coordinates of each location within the map to confirm its precise geographic placement. States that work to embed geographic granularity into their processes for mapping current broadband service and speed availability in their state will effectively target broadband funding towards the areas of most need.
As the FCC works on implementing the new Broadband Data Collection program to improve the granularity of their national broadband maps, states, and other organizations will need to consider how they will map broadband availability to make the most of upcoming broadband funding.
How are states adding granularity to broadband maps?
Many states recognize the vital role a geographically granular broadband map of service availability plays in supporting statewide plans and funding decisions. With the FCC’s Form 477 data as the only public source to pull from publicly, some states are setting out on their own to map broadband service availability below the census block. Others turn to NTIA’s National Broadband Availability Map (NBAM) to supply them with service availability information and other data layers.
NTIA’s National Broadband Availability Map
About two-thirds of the states belong to NTIA’s NBAM program, which gives members access to a GIS (Geographic Information System) platform that allows users to visualize and analyze federal, state, and commercially available data sets. In addition to supplying states with tools and data, it also provides an interactive public map that enables users to explore different datasets about the areas where people do not have quality broadband access.
Custom methodology using public + private data
Alongside the NBAM program, a recent study conducted by PEW research found that 36 states have a public broadband map of service availability for their state. Each state’s methodology to create its broadband map varies, but most states rely on FCC Form 477 coverage data, build their own custom mapping processes then add geographic boundaries, funding information, and other attributes for additional depth. The states with the broadband maps that yield the most clarity and precision in service availability by location are the ones taking coverage mapping into their own hands.
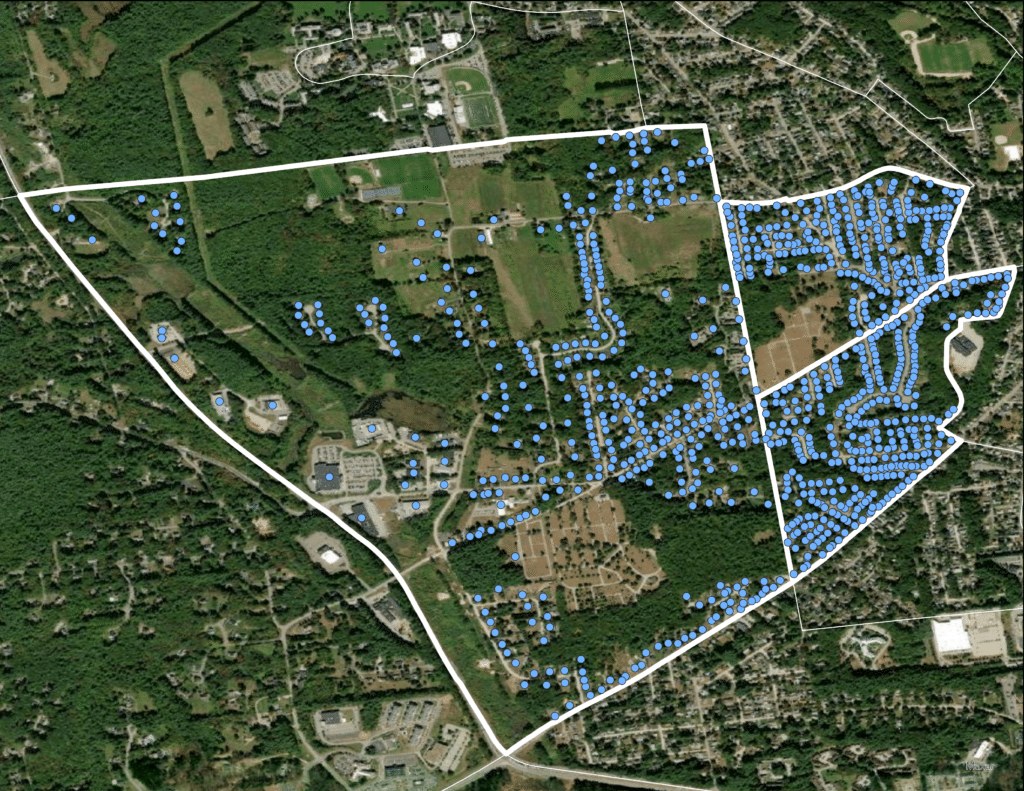
The state broadband maps producing the most accurate views of their broadband coverage landscape use location-level and/or sub-census block polygon data. The FCC’s Form 477 data shows broadband service availability at the census block level. While some states use address geocoded data sets, others get even more accurate by mapping to the latitude and longitude of the structure or building that requires broadband service. This structure-level mapping is referred to as Broadband Serviceable Location Fabric mapping, which is the direction the FCC is actively working on.
Innovative state mapping programs
State broadband mapping programs that are leveraging the latest technology and techniques are mapping at the structure level. Many are collecting serviceable addresses or structure coordinates from service providers, giving them more control over recency or vintage of data, and at times, more control of the standards with which providers submit data.
These mapping programs focus on locational precision and provider submission standards and build in layers and functionality to serve both the public and policymaking views.
We’ve looked at several state broadband maps, researched the mapping programs behind them, and identified a few that stand out.
Good interactive state broadband maps:
- California: Has a dedicated data collection program, has a multitude of funds, and has demographic, investment, and other informational layers. They use Structure/Broadband Location Dataset for cost model/investment layers and e911 data for public map locations.
- Georgia: Has a dedicated data collection program tied to its funding program. In addition, they have built a custom Structure/Broadband Location Dataset. The program also has internally mapped investment model data.
- South Carolina: Has a dedicated data collection program and uses an address-level location data set tied to their provider submissions. They have an internal analytical viewer map, with required investment per each location, plus other layers.
Building a granular state broadband map
A granular broadband map acts as a critical foundation for accurate decision-making when planning to close the Digital Divide. Whether attempting to understand the required investment, network design, or funding requirements, having a map that shows you the exact coordinates of the locations in need of broadband is a critical starting point. Precise location data provides the foundation for decision-making and public display of broadband availability.
There are various methods states can use to develop a broadband map, but not all will produce the same level of precision and granularity most desired for effective network planning.
To generate a granular broadband map, at a minimum, you need to include location (structure) coordinates and well-defined locations marked that require broadband service.
If the underlying locational geography in your broadband map is off or too aggregated, then:
- Service availability will be OFF
- Targeting of funding programs will be OFF
- Public trust in maps will be OFF
Creating a broadband map for effective policy-making
To better support policy-making and decisions about broadband infrastructure deployment, your map should contain these attributes:
1. Locations at sub-census block geography
Mapping broadband service availability below the census block level allows you to view service availability by structure compared to viewing locations in aggregates, making it difficult to precisely understand where service is currently unavailable and how and where to target funding or other initiatives.
2. Structure coordinates of locations
Embedding coordinates and addresses into your map will help confirm exactly where the structure of the location most likely to receive broadband service is on the Earth.
3. Accept consumer feedback
Setting up a way for users to submit feedback on the state’s broadband map gives consumers a way to challenge service claims. Accepting consumer feedback shows good faith that the state cares about equalizing everyone’s access to broadband service.
4. Data layers for additional analyses
The more granular and informative your broadband map is, the more efficient your team will be at planning and designing plans to the locations that need it. Using conditional logic, you can weave in additional data layers, such as funding programs, technology availability, demographics data, and more, giving you a depth of information to fully assess broadband needs and potential solutions.
Other items to consider when building a broadband map
Public-facing vs. Policy-making broadband maps
Each state approaches broadband mapping a little differently to view broadband service availability in a way that is most beneficial to their needs. Some states create their broadband maps for the public to use, facilitate policymaking and funding allocation, or both. While there is no “right” way to map broadband, there are benefits to having two forms of broadband maps, one for the use of the public to track service availability and one for the support of policymaking.
Public-facing
A public-facing map’s primary focus is to provide consumers with a view of broadband service availability throughout their state. Public-facing broadband maps have a slightly different emphasis than policymaking maps. Public-facing maps primarily focus on giving consumers a way to see what service providers claim to provide to their location and at what speed and type of service broadband is available in. Giving consumers a place to check where they can access broadband service shows good faith from the state by being upfront and keeping them up to date on their state in terms of broadband availability.
After reviewing various state broadband maps, the ones that stood out as excellent public-facing maps contained the following attributes:
- Accuracy to the location (address or building level)
- Ease of use
- Ability to input an address
- Accept customer feedback/challenge
- Filters for attributes such as service provider, service speed available, and technology type
Policy-making
A policymaking map focuses on displaying broadband availability in a format that allows policymakers and key stakeholders to inform their decisions about providing broadband service to locations without access. To better inform policy, these maps should be as granular and precise as possible by pinpointing the exact structures in need of broadband service and who provides service in the area (by technology). Structure-level maps help provide the level of granularity required to truly assess the needs of the locations lacking access and drive more accurate decision-making.
After reviewing various state broadband maps, the ones we thought were good for policymaking entailed the following attributes:
- Structure-level mapping for a clearer picture of service availability and accuracy for targeting funds
- Boundaries for jurisdictions, planning districts, congressional/legislative districts, etc.
- Layers for funding areas (current & future)
- Display of investment needed to build out to the locations unserved with broadband service
Census block-level data can skew state broadband maps
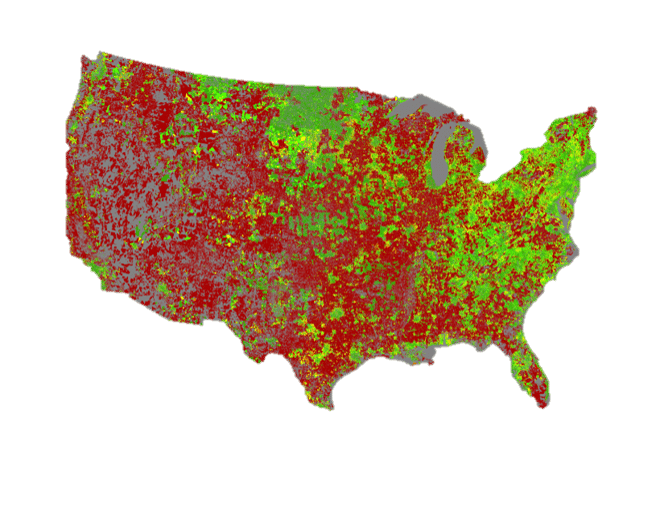
Congress and many others in the industry recognize the flaws & lack of granularity within the FCC’s Form 477. This lack of granularity comes from the fact that if an ISP states it offers service to one location in a census block, then the FCC would count that entire census block covered by that provider. This aggregation leads to over-reporting of broadband service availability, as it underestimates the exact number of locations needing broadband service. When over-reporting occurs, it results in an inaccurate view of broadband coverage in that area, making it tricky to draw plans from.
To improve broadband mapping, Congress ordered the FCC through the BroadbandDATA Act to create the Broadband Data Collection (BDC) using advanced data methods and standards to capture availability at the location (structure) level. The BDC will have a new set of reporting requirements & challenge processes in place that will ask providers for additional detail that will add the level of granularity needed to map broadband availability.
Summary
As new funds become available to expand broadband infrastructure, it is crucial for states to get broadband mapping and coverage identification right. Granular broadband maps provide the foundation for accurate decision-making when planning to close the Digital Divide. States that embed geographic granularity into their processes for mapping broadband service and speed availability in their state will effectively target broadband funding towards areas of most need.
Whether it’s decisions regarding policy-making or network planning, working from inaccurate data can lead to unwanted variability in broadband service availability, targeting of funding programs, and cost estimations.
States need to maximize federal and state funding to expand broadband access to those currently unserved. With broadband acting as a core service that binds the modern world together, providing broadband service to all Americans is more important than ever. Granular broadband mapping can help make the delivery of broadband service to all a lot more attainable.