
Precision agriculture stands at the forefront of modern farming advancements—promising higher yields, improved resource use, economic development, and increased sustainability. Yet this potential relies on one crucial input: high-speed, reliable broadband connectivity to power the tools that enable farming advancements. The future of agriculture is digital, and it is rapidly arriving. Emerging trends and advancements include:
- Deploying Internet of Things (IoT) connected farm equipment, such as tractors and harvesters, communicating over high-speed networks
- Accessing real-time data for adaptive decision-making for crop management based on sensor data
- Automating irrigation, fertilization, and harvesting processes to improve sustainability practices
- Optimizing operational efficiency through smart supply chains by linking farm data directly to logistics and markets
However, many agricultural lands throughout the U.S. lack access to adequate broadband internet. Without sufficient broadband service, farmers are unable to fully leverage advancements in AI-driven technologies, IoT systems, and automated machinery, which are essential to precision agriculture practices.
Impacts of insufficient broadband coverage for agricultural lands
Insufficient broadband access in rural areas where agricultural practices mainly take place not only impacts individual farming operations, but also the broader goal of U.S. national food security, efficient resource allocation, and rural economic development.
The US Chamber of Commerce reported that, “Precision agriculture technologies could increase U.S. crop production by 4% and reduce input costs by 7%, which would generate nearly $13 billion in net farm income annually.” However, adoption hinges upon whether adequate broadband service is available to power it.
CostQuest’s newly developed tools enable mapping and visualization of agricultural connectivity needs using granular geospatial data. These tools enable the identification of where farms exist, which are served, and which are not served with adequate internet. Understanding where networks should be prioritized is the next critical step to ensure private and government funds for infrastructure deployment are spent effectively and wisely to support agricultural areas.
Tackling the challenge of agricultural coverage mapping
For more than a year, CostQuest has been working to tackle this problem and shed light on where and how broadband should be deployed in rural America to aid precision agriculture. The first step was identifying what agricultural lands and support structures may require service. The second step was identifying the coverage gaps in those areas to determine size and scope, and identify possible approaches to close them. Then, CostQuest modeled a solution that identifies the necessary investments and the most efficient network design to provide service to underserved and unserved areas.
The model that made all of this possible required CostQuest to develop new mapping tools to expand the identification of key agricultural structures, such as barns, silos, and crop fields. These new tools enable CostQuest to identify agricultural support structures that require broadband access to enable precision agriculture adoption.
By combining the National Location Fabric data, cropland layers, FCC Broadband Service Availability Data, and advanced geospatial models, CostQuest is working to build a foundational dataset that can deliver a complete view of broadband service availability for agricultural lands and the cost to deploy smarter, more targeted infrastructure expansion to support the growth of precision agriculture practices in America.
Precision mapping process for agricultural areas with CostQuest’s Geospatial Framework
CostQuest’s methodology for agricultural broadband mapping is based on a systematic, layered, and geospatial approach that integrates multiple authoritative data sources and algorithms:
Step 1: Identify agricultural lands and support structures
CostQuest’s process for identifying agricultural lands and agricultural support structures combines the Broadband Location Fabric, crop land data, tax assessor information, hexagonal grid data, and custom algorithms.
a. Use Location Fabric and secondary structures as the foundation:
Over the past couple of years, the industry has become familiar with the FCC’s Broadband Location Fabric, built by CostQuest to meet the Broadband Data Act’s clear definition of a “Broadband Serviceable Location” (BSL)—a business or residence where fixed broadband can be installed.”
In the Fabric data development process, CostQuest also identifies secondary structures on parcels, which are stored in a separate database from the federally defined Fabric dataset delivered for federal programs. However, these secondary structures are useful for mapping additional locations and/or structures that may need broadband service.
By combining the Broadband Fabric with secondary structure data, we now have a strong geographic foundation to layer in additional insights to create a better understanding of broadband coverage needs in the surrounding areas of primary structures (BSLs).
b. Add USDA Cropland Data:
To refine agricultural land identification, CostQuest overlays the USDA Cropland Data to understand what IS agricultural land.
c. Add Tax Assessor Data:
Additional data sources, such as tax records, help determine parcel boundaries, aggregated parcels that form common ownership of the land, and farm types (e.g., ranches, dairies).
d. Apply Hexagonal Grid System (H3 9 Level):
Where parcel data is incomplete or inconsistent, CostQuest applies a standardized hexagonal grid system (about 200 meters across) to normalize geographic analysis and maintain mapping precision.
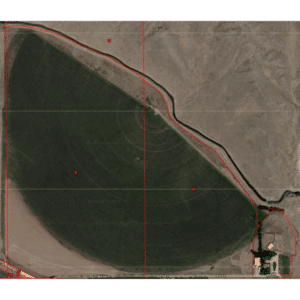
An example of a parcel with an active BSL and agricultural cropland. CostQuest uses a combination of primary and secondary Fabric data, USDA Cropland Layers, and tax assessor information to pinpoint agricultural land and agricultural support structures.
Step 2: Map Broadband Coverage Gaps
Once agricultural parcels and structures are identified, the next step is evaluating service availability:
a. Spatial Structure Analysis:
By identifying primary agricultural structures (e.g., grain silos) and applying spatial analysis, CostQuest can work to infer the surrounding agricultural activity around existing active Broadband Serviceable Locations in the Fabric.
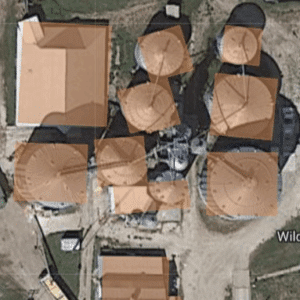
An example of identifying the building footprints of agricultural secondary structures.
b. Layer in Broadband Service:
Using FCC Broadband Data Collection (BDC) data, CostQuest overlays the reported broadband service with the primary and secondary Fabric structures and agricultural land data layers. This layering of coverage includes both landline and wireless availability information.
c. Layer in Supplementary Data:
Employee classifications and federal subsidy records further enrich the models, thereby improving agricultural mapping accuracy.
The Result: Coverage maps of agricultural areas
Now we can bring all the data and models together. The image below shows an example of how CostQuest overlays FCC Broadband Data Collection (BDC) data on CostQuest’s Broadband Location Fabric, agricultural structures, and land data in the Hexagonal Grid System format.
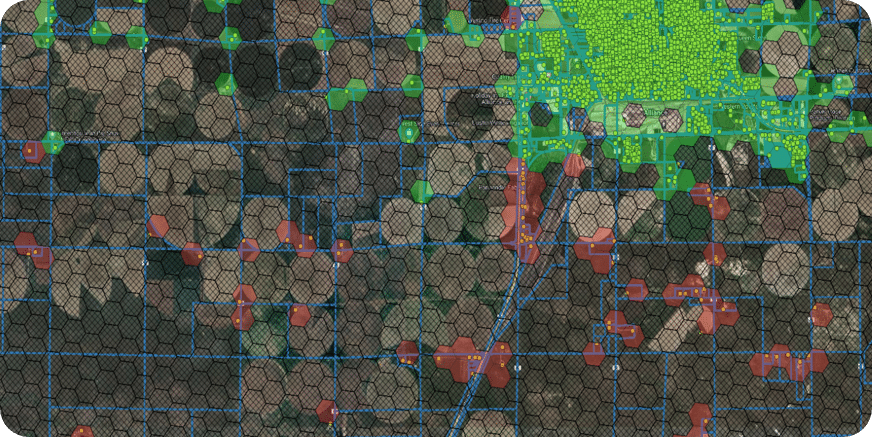
An example map of FCC Broadband Data Collection (BDC) data (Version 4) layered on CostQuest’s Location Fabric (Version 4), agricultural structure, and land data, in the Hexagonal Grid System format.
Next, CostQuest combines statistical models to detect where coverage exists and where it may not, in agricultural areas where it is needed. The image below shows a specific example of our team working to detect fiber coverage in this agricultural area based on reported service to the active BSLs (Broadband Serviceable Locations) highlighted in bright green.
The result of our agriculture mapping process: A multi-source, geospatially validated structure-level understanding of where broadband coverage, both landline and mobility, is and isn’t across America’s agricultural regions.
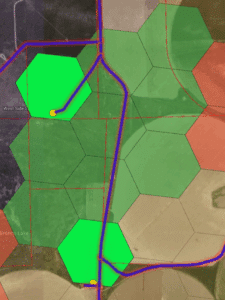
- The Bright green = known status from BDC reporting.
- Shaded green = unknown (not reported), but estimated to have fiber availability based on surrounding BSLs.
- Determination of the hidden structure of the fiber (purple) infrastructure based on a model of terrain and roads.
Next Step: Analyzing where to deploy infrastructure and what type
Through our process of identifying technology-specific coverage gaps in agricultural areas, policymakers and providers can now uncover coverage gaps and assess whether areas with existing service have adequate bandwidth to support precision agricultural activities. Therefore, helping inform the targeting of federal funding and private investments toward infrastructure deployment where it will have the highest impact—accelerating the adoption of precision agriculture across the nation.
Below is a preliminary analysis of fiber and 5G broadband coverage in Arkansas’s agricultural areas. In Arkansas, CostQuest identified that there is more 5G coverage for agricultural areas compared to fiber coverage:
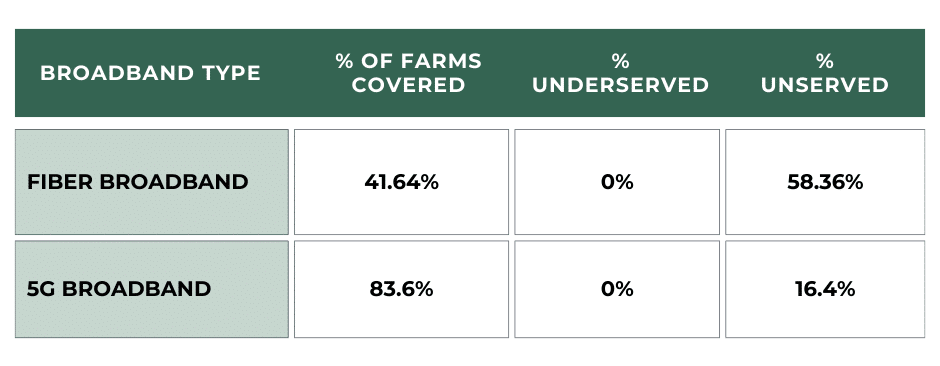
Fiber vs. 5G Coverage in agricultural areas of Arkansas using FCC BDC Version 4 data.
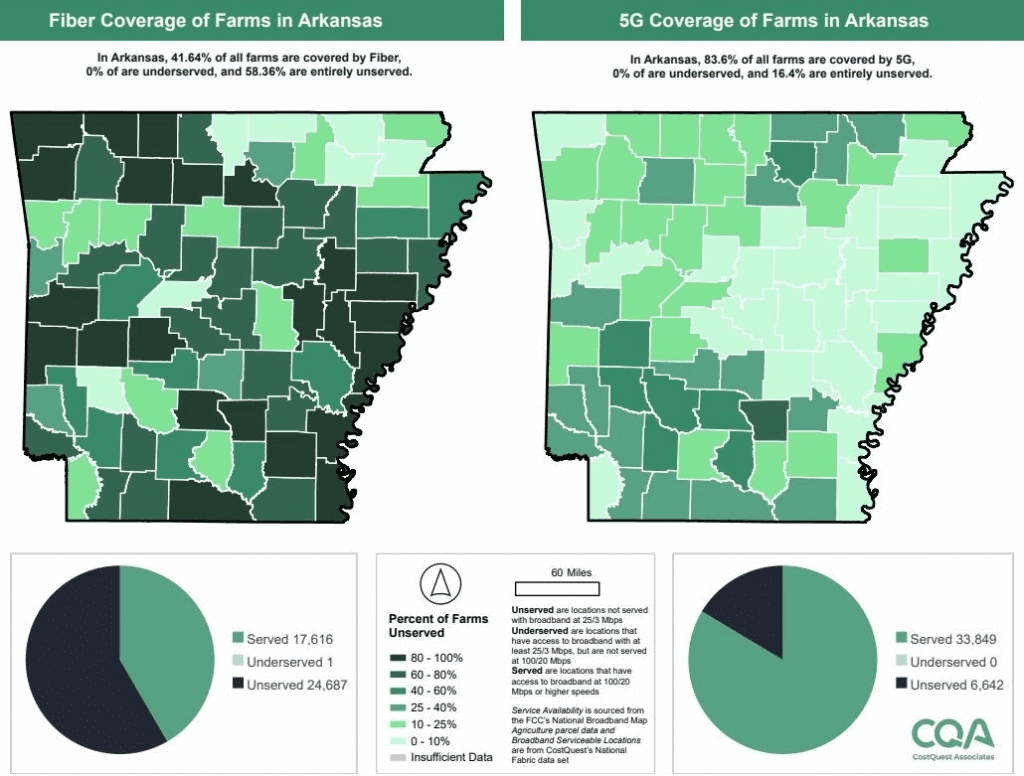
State-level broadband coverage for farms in Arkansas shows significant fiber service gaps despite broader 5G availability, according to FCC BDC Version 4 data.
From this preliminary analysis, network investments required to provide service can be modeled. With this information, deployments can be targeted to the type of infrastructure that best supports precision ag practices in Arkansas’ unserved agricultural areas—whether 5G is adequate, fiber is essential, or alternative technologies can play a role in delivering coverage.
Closing thoughts
Precision agriculture represents a transformative opportunity for American farming—one that can enhance food security, rural prosperity, and environmental sustainability. However, for these innovations to reach their full potential, adequate broadband and targeted investments are required to reach secondary agricultural structures, fields, pastures, and remote agricultural operations.
Advanced geospatial mapping methodologies, like the one described above, to create a granular structure-level view of agricultural coverage gaps, are essential to mapping where broadband infrastructure needs to be deployed to launch precision agriculture innovations into America’s future.