
By Mark Kennet, Ph.D., Senior Consultant, CostQuest Associates
5G technology is more than just faster mobile internet, it’s a catalyst for economic growth, innovation, and digital access. By 2030, 5G technology is expected to contribute a staggering $1.3 trillion to global GDP, with $484 billion in the United States alone.
According to Price Waterhouse Cooper’s global analysis, the largest impacts will be felt in the health sector, followed by utilities, consumer and media applications, industrial manufacturing, and financial services. But what does this mean for states currently struggling with connectivity gaps, and how can telecom providers capitalize on this massive opportunity?
This 5G expansion analysis explores the:
- Economic challenge & long-term beneficial impact of 5G expansion
- Cost of 5G deployment vs return on investment (ROI) for extending coverage to unserved locations
- Mapping the cost of 5G expansion
The Economic Challenge: The 5G Coverage Gap
Despite significant advancements in 5G technology, coverage disparities persist across the U.S., particularly in rural and underserved areas. A CostQuest detailed analysis of three diverse states—New York, Kentucky, and Mississippi—reveals both the challenges and the extraordinary economic potential of closing these gaps. The percentage of locations without 5G access varies significantly:
- New York: 4.5% unserved
- Kentucky: 16.9% unserved
- Mississippi: 10.6% unserved
These gaps represent missed economic opportunities, as regions without 5G connectivity face limitations in productivity, innovation, and job creation. A key question arises: Is the investment required to bridge this gap justified by economic returns?
The Economic Impact of 5G Expansion
A study by Aron, Ukhaneva, and Sun estimates that for every 1% increase in 5G penetration, U.S. GDP per capita rises by 0.035%—equating to an economic boost of approximately $9.2 billion annually for the entire United States.
When we apply these economic models to individual states, the potential impact becomes even more compelling. Our analysis shows that bridging the 5G gap in unserved locations would generate significant annual increases in per capita GDP:
- New York: $185 increase per person ($3.6 billion total)
- Kentucky: $380 increase per person ($1.7 billion total)
- Mississippi: $196 increase per person ($576 million total)
These numbers highlight the tangible economic benefits of 5G investments, particularly in regions that currently lack robust connectivity.
The Cost of 5G Deployment vs. ROI
Expanding 5G infrastructure comes at a cost, but the potential return on investment (ROI) is compelling. According to CostQuest analysis, when comparing annual GDP gain to deployment cost, the ROI for 5G expansion in these states is impressive:
- New York: 405% ROI (~$3.6B GDP gain vs. $559M cost)
- Kentucky: 163% ROI (~$1.7B GDP gain vs. $662M cost)
- Mississippi: 187% ROI (~$576M GDP gain vs. $185M cost)
This means that for every $1 invested in expanding 5G access, the economic return is between $1.79 and $3.47—a strong justification for accelerated infrastructure deployment.
Investment Breakdown and Projected Gains by State
Below is a breakdown of the estimated investment required, annual cost, and GDP gain for 5G expansion in New York, Kentucky, and Mississippi:
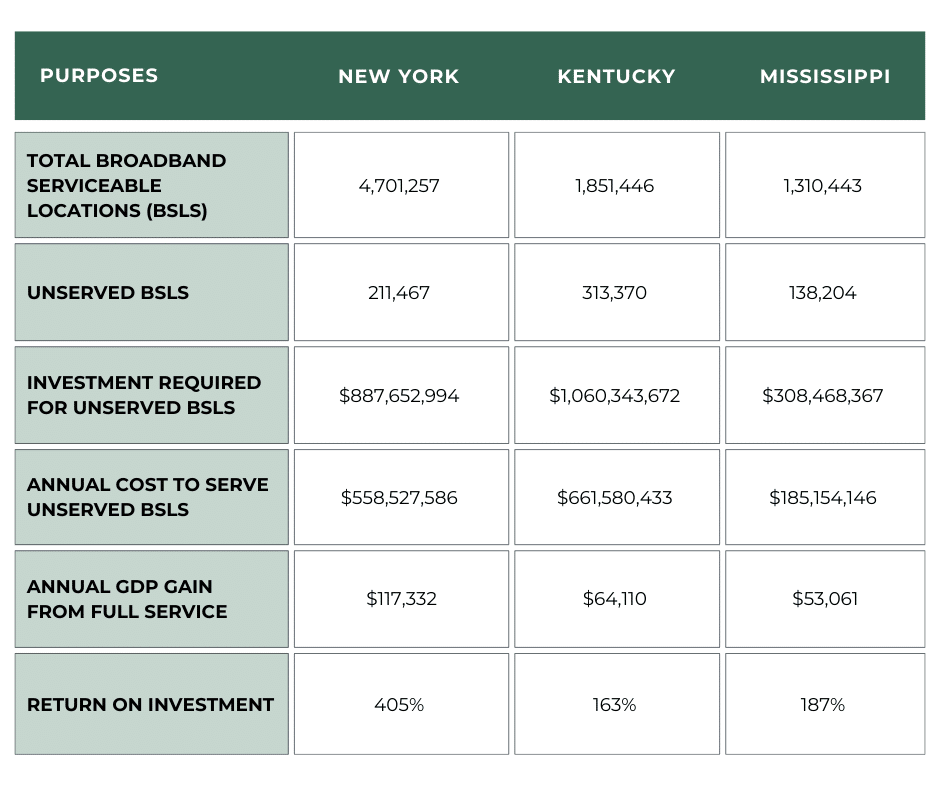
Estimated investment required, annual cost, and GDP gain for 5G expansion.
These figures indicate that the economic “profit” from investments in expanding 5G in these states is significant—with returns ranging from 163% to 405%. This aligns with other studies, such as research from Purdue University, which found benefit-cost ratios of up to 4:1 for rural broadband investments in Indiana.
Mapping the Cost of 5G Expansion
Understanding where to prioritize investments requires granular geographic analysis. The maps below illustrate the capex per subscriber for 5G deployment to served and unserved locations in New York, Kentucky, and Mississippi. The areas with the dark gray background represent the areas that are unserved, and the colored layers on top of those gray areas represent the capex per subscriber to expand 5G to those unserved areas:
- Green represents the least costly regions to expand 5G.
- Red indicates the most costly regions to deploy 5G infrastructure.
- Uncolored are areas where there are no BSLs or road miles.
These insights help policymakers and telecom providers prioritize investment based on cost-efficiency and potential economic returns.
New York – 5G Expansion Cost Map
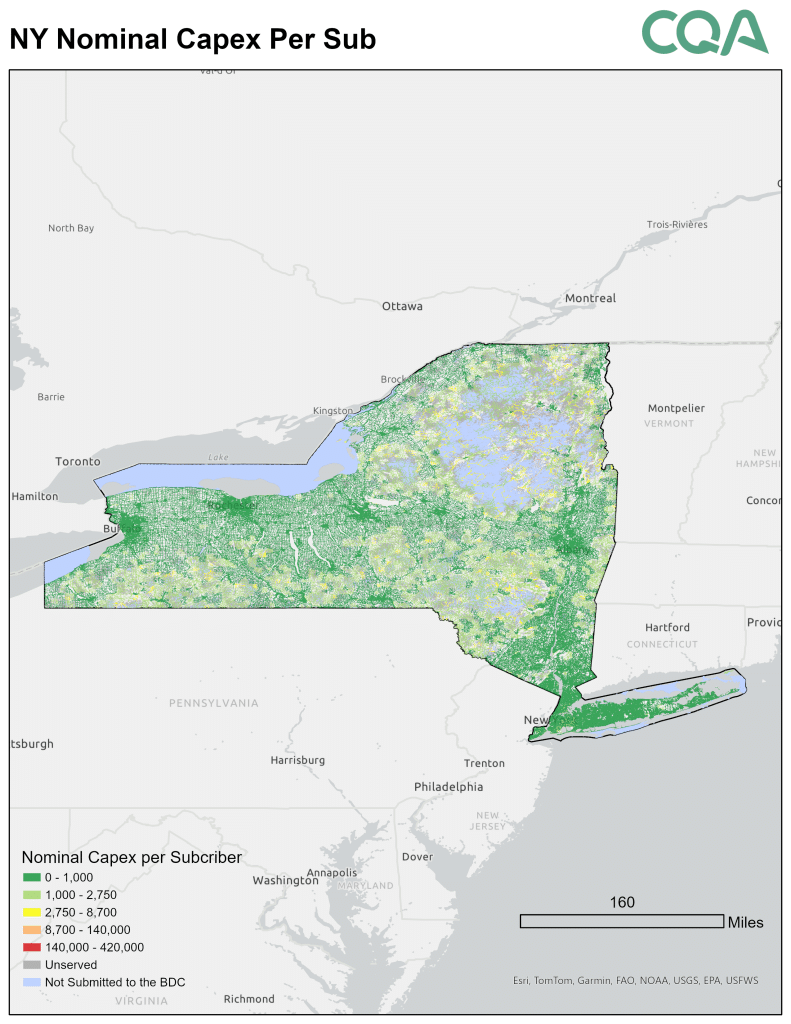
Nominal Capex per Subscriber for 5G expansion in New York.
Kentucky – 5G Expansion Cost Map
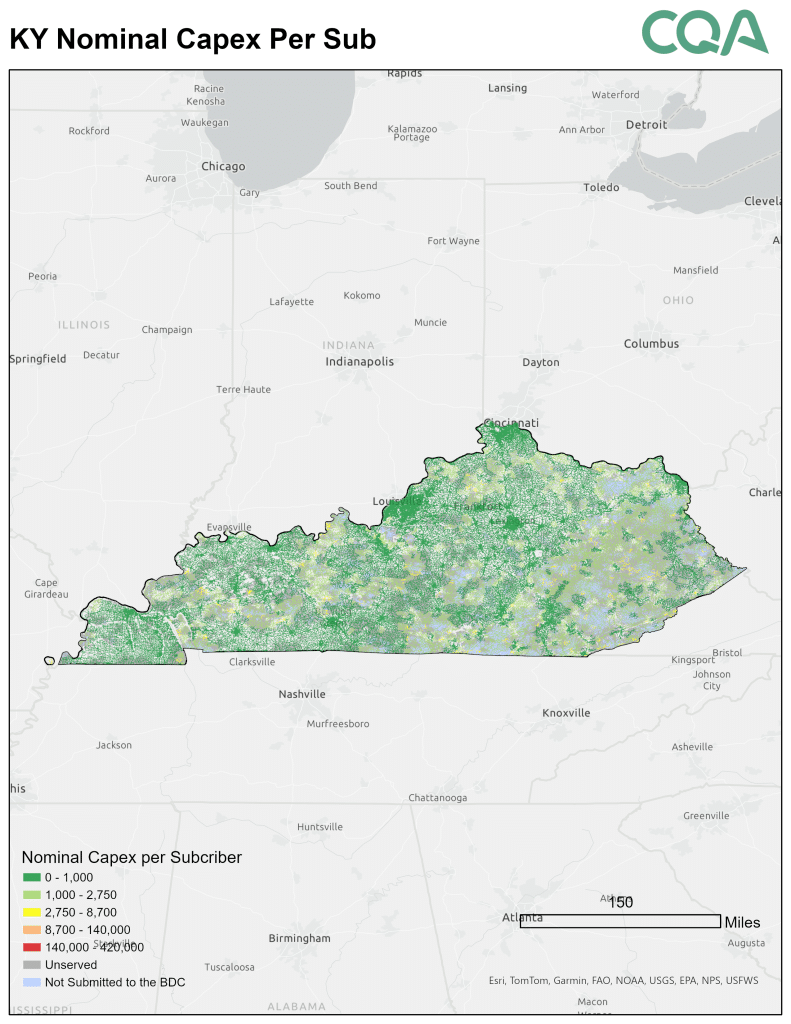
Nominal Capex per Subscriber for 5G expansion in Kentucky.
Mississippi – 5G Expansion Cost Map
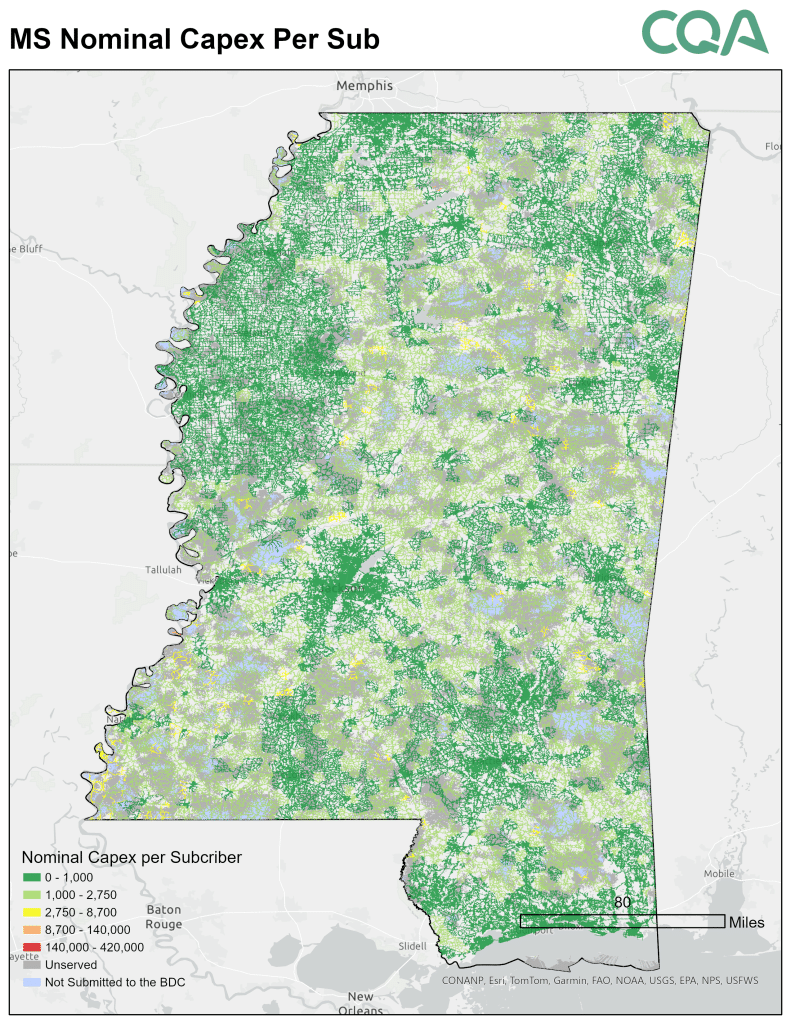
Nominal Capex per Subscriber for 5G expansion in Mississippi.
As expected, densely populated regions with flat topography require less investment to expand 5G, while rural and mountainous areas face higher costs due to infrastructure challenges.
Conclusion: A Methodology for Evaluating 5G Expansion
The methodology used in this analysis provides a data-driven framework for evaluating broadband expansion opportunities. By assessing the economic impact, cost distribution, and ROI of 5G infrastructure investments, telecommunication companies and policymakers can make informed decisions about where and how to allocate resources.
CostQuest Associates recommends using this approach to evaluate future broadband investment proposals, ensuring that funding is allocated to areas with the highest economic returns.
The economics of 5G expansion are clear: investing in connectivity today leads to exponential economic returns tomorrow. Regions that proactively adopt 5G will maximize both business and social impact.
Looking to optimize your 5G expansion strategy? Contact us for a customized ROI analysis tailored to your market.
Sources
- CostQuest Associates – Original analysis by Mark Kennet, Ph.D., Senior Consultant
- Aron, D.; Ukhaneva, O.; and Sun, C., “The economics of 5G deployment in the ‘race’ to 5G: The economic effects of adopting new technology.” Charles River Associates, 2021.
- Grant, Allison; Tyner, Wallace E.; and De Boer, Larry (2018). “Estimation of the Net Benefits of Indiana Statewide Adoption of Rural Broadband,” Publication 006, Purdue University Center for Regional Development.
- CostQuest Associates assumes that the percentage of unserved population is the same as unserved locations.
- Broadband Serviceable Location (BSL) represents a business or residential location in the United States at which mass-market fixed broadband Internet access service is, or can be, installed. About the Fabric: What a Broadband Serviceable Location (BSL) Is and Is Not – BDC Help Center.