
Broadband expansion planning is a lengthy endeavor. It requires a thorough in-depth analysis of where to target a network build and identify the resources required to complete the project.
When planning, you want to be sure to identify the areas that hold the most opportunities for your network business and state, that not only benefit the bottom line and reach business goals but also capture the potential funding sources you may need to subsidize costs.
Below are 7 tips to help guide you through your broadband expansion planning:
1. Acquire reliable data and build granular location-level broadband maps that can effectively inform your broadband expansion planning decisions.
Geographically accurate and insightful data at the structure level gives you a clear picture of the broadband needs across your region or state and helps effectively guide the subsequent analysis and decisions sourced from the data and maps.
Considerations – are there funding programs that can subsidize the planning materials you need for broadband deployment? Some funding programs, such as BEAD, allow you to use funds to acquire broadband mapping data. It is widely recognized that using quality data is vital when it comes to informing broadband expansion decisions.
2. Use your broadband maps to identify and qualify locations near your existing service area that need broadband services.
Where are the unserved and underserved locations, how many are there, and what type of location is it – residence, business, multi-dwelling unit (MDU)? Are there service adoption concerns due to socioeconomic factors? Could you implement a lower-cost services pricing plan to drive more adoption?
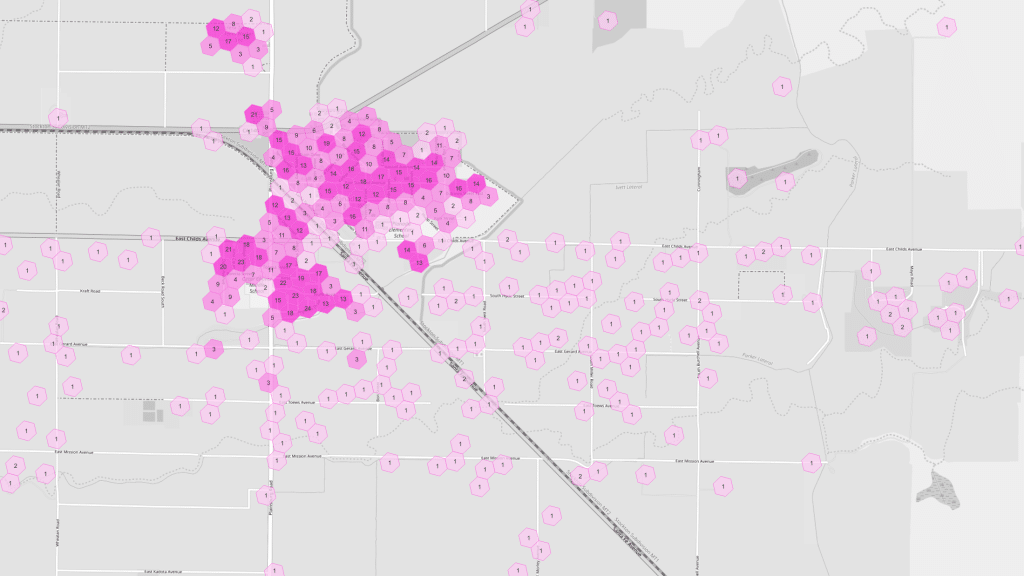
For reference, above is a visual example using CostQuest’s BroadbandFabric data that shows Fabric Broadband Serviceable Location counts, with the darker shaded areas indicating higher density areas. In an H3_10 hex polygon format.
3. Understand bandwidth demand trends from consumers and aim for high-speed broadband connectivity solutions, such as Fiber. Also, identify which areas may require alternative high-speed connectivity solutions.
What are the bandwidth demands of consumers? What areas can you deploy fiber-optic technology to? What areas may need alternative high-speed solutions, where fiber is not economically feasible?
4. Build a comprehensive business case and cost model outlining the initial investment needed, capital expenditure, operating expenses/cost to maintain over time, adoption take rates and revenue potential.
Considerations of where and how to prioritize your network build can ultimately benefit your network business the most, identifying commercial viability holds the key.
What areas are the most feasible to build to? What areas are high-cost and have barriers to build to, factoring in protected lands, potential permits needed, and terrain? Certainly, density is typically at the top of the list of drivers for viability. The inverse relationship between cost and density needs to be understood, and the consideration of public funding opportunities needs to be measured. The chart below exhibits this relationship and the importance of understanding how this plays out in areas you’re considering for growth.
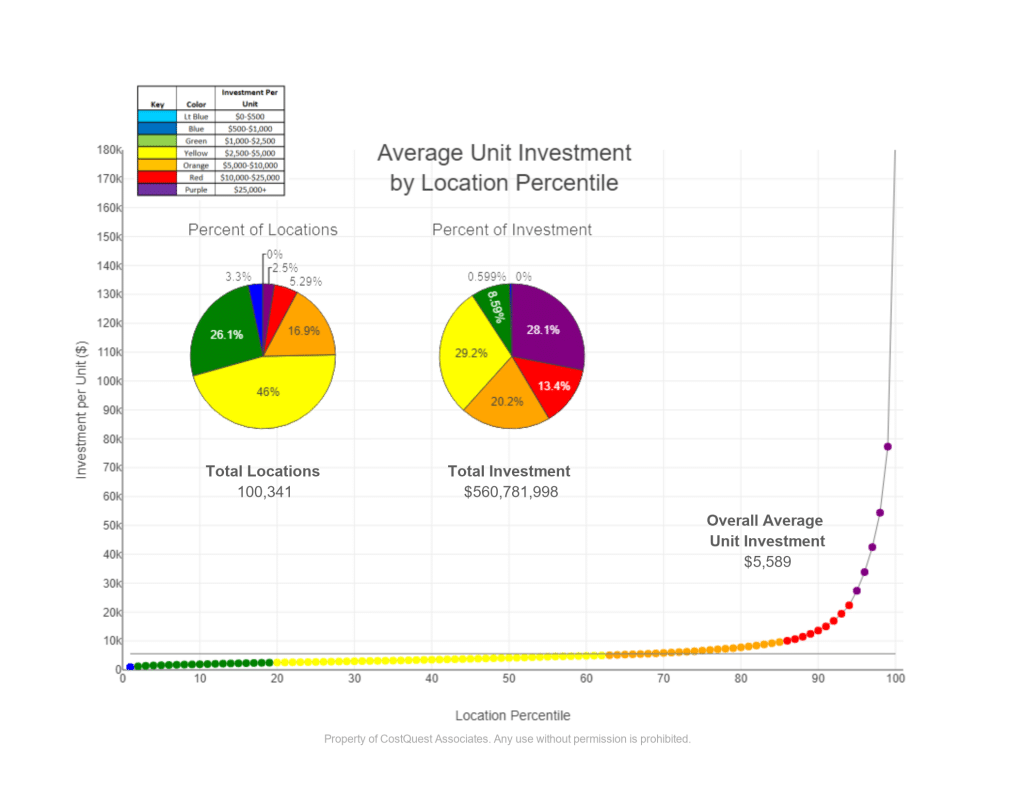
For reference for sample State A, above is a graph showing the total investment and average unit investment to deploy Fiber to all the unserved locations. The purple dots represent the low-density areas with locations in the top percentile in terms of needed investment. In other words, for example, 2.5% of the locations in State A will require 28.1% of the total Fiber investment.
*The number of unserved locations was identified using CostQuest’s BroadbandFabric (Fabric) and Technology Availability Layer (TAL) data. The cost investment per location was identified using CostQuest’s Fiber Cost Model data.
6. Identify what unserved and underserved locations are already covered under existing funding programs such as CAF and RDOF.
Locations covered under existing funding programs such as CAF and RDOF will not be eligible for BEAD funding.
7. Identify if you need additional funding sources to help subsidize costs for high-cost areas and maintain the network over time.
Consider if you need to leverage USF (CAF/ACAM) or other funding sources.
Now target broadband expansion to the areas:
- With the most unserved/underserved locations
- With the network business growth potential
- Where funding grants can be applied
Next:
- Select high-speed broadband technology solutions.
- If you belong to an internet service provider or other entity seeking grant funding or a state or territory proposing the use of awarded grant funding, apply for necessary funding programs leveraging the information you’ve gathered in the above steps to present your initial investment to service, information on unserved areas to target first, high-speed technology solutions, and the potential of a low-cost subscription plan to help address socioeconomic adoption barriers.
- Gather necessary capital for initial investment and develop a plan to account for the cost to maintain in the future.
The more detailed and comprehensive your broadband expansion planning, the more prepared and successful you will be when it comes time to get boots on the ground for network build-out. While mitigating potential risks and barriers you could hit along the way.