
U.S. broadband coverage improved nationally between June and December 2025, but a location-level view reveals progress that is neither uniform nor linear, with local variation, federal funding, and rising competition now defining the market’s next phase.
This Broadband in America Report delivers a data-driven analysis of the U.S. broadband market, drawing on the FCC’s Broadband Data Collection and CostQuest’s® Location Fabric Versions 7 and 8 (June 2025 through December 2025), covering 116.5 million Broadband Serviceable Locations (BSLs) and 2,129 reporting ISPs. It examines how served, underserved and unserved status shifted nationally and at the county and BSL level, offering a granular view of where coverage gains are real, where federal funding is producing measurable results, and how fiber and fixed wireless competition is reshaping local markets.
National gains are real, but local markets reveal a more nuanced story
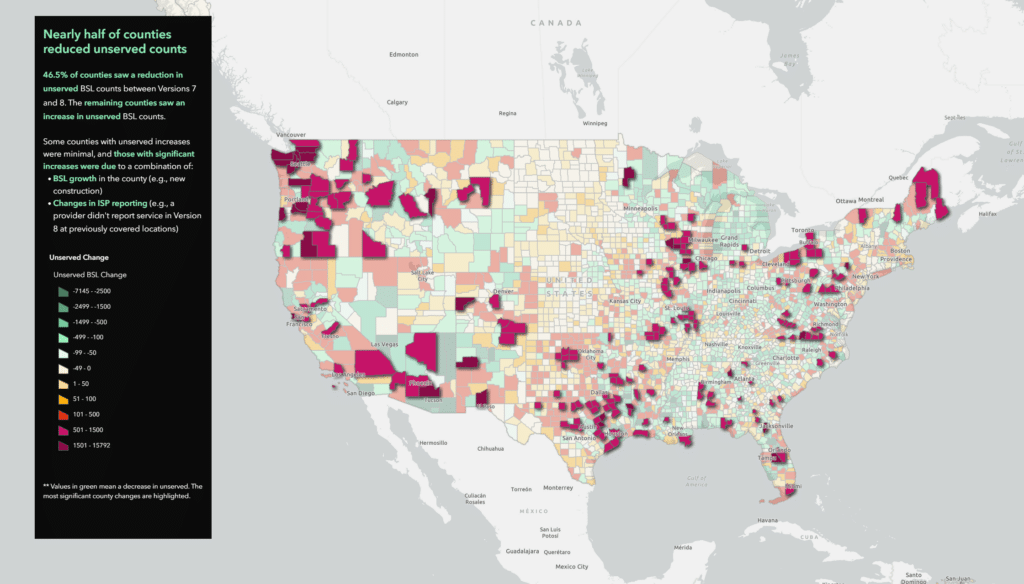
Nationally, served locations grew from 110.2 million to 111.2 million, while unserved and underserved counts both declined. Fiber, licensed fixed wireless (FWA) and federally funded builds continued to expand. But national gains mask meaningful variation by county and BSL: some markets saw substantial coverage improvements, while others saw unserved counts rise due to new construction, changing provider footprints or reporting shifts. Understanding the technology and provider behind each change is essential to distinguishing real expansion.
Federal funding is being deployed and is producing measurable results
Among 9.9 million federally funded, non-BEAD BSLs, 82.5% now have access to at least 100/20 Mbps service. With nearly 3.5 million additional BSLs awarded BEAD funding as of June 2026, this expansion is expected to continue, reinforcing federal programs as a durable driver of coverage progress.
Fiber and FWA expansion is raising the competitive baseline nationwide
Fiber and FWA are expanding across much of the country, raising the competitive baseline in markets that previously had limited high-speed alternatives. Nearly 43% of federally funded served BSLs, in non-BEAD areas, now have access to more than one provider, underscoring that funded areas are increasingly becoming contested markets rather than simple deployment opportunities. As coverage gaps narrow, competitive advantage will depend less on first-to-market deployment and more on knowing where local markets are changing, how funding is shaping future builds, and where new technology and provider choices will affect penetration, retention and growth.
Click here to scroll through broadband maps, analyze coverage trends, and dive into the Broadband in America Coverage Report—July 2026 Edition.
This report will be updated twice a year when the latest data is released. If you have any questions, please contact [email protected].