
Fiber broadband has grown 58.7% in four years: here’s who’s building it and what’s coming next.
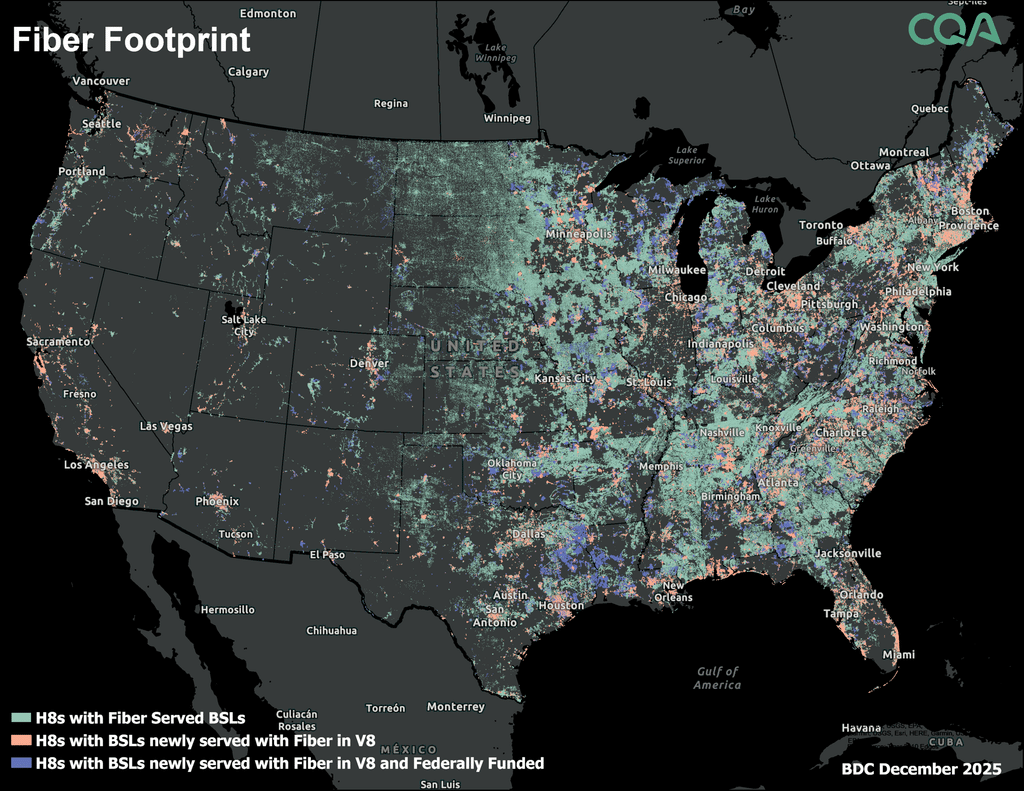
U.S. fiber broadband deployment is accelerating, and CostQuest’s newest fiber focus report offers a forward-looking view of where fiber coverage is expanding, who is building it and how federal funding is reshaping the competitive map. This monthly installment of the Broadband in America Report builds on prior fiber editions, tracking service availability, economics, competition and funding across the fiber landscape nationwide.
Fiber broadband’s continued rise
Fiber is now serving 58.7% more U.S. homes and businesses than it did four years ago, with more than 26.6 million Broadband Serviceable Locations (BSLs) gaining fiber access since Version 1 of the Fabric, including 6% growth in just the past six months. As of the latest FCC Broadband Data Collection release, 1,593 active fiber providers now cover 62% of all BSLs nationwide.
Federal funding fueling fiber broadband expansion
Federal programs remain a major accelerant of fiber deployment, especially in rural America:
- BEAD awards slate 64% of covered BSLs for fiber service1
- EACAM supports 2.4 million fiber locations
- RDOF supports 1.9 million fiber locations
- CAFII supports roughly 198,000 fiber locations
Competitive dynamics reshaping the fiber broadband market
AT&T leads the fiber market with over 19 million served BSLs, while cable companies – Cox, Charter, Comcast and Optimum – are rapidly expanding their own fiber footprints, now topping 6.8 million BSLs combined. Meanwhile, smaller and mid-sized providers like Mediacom Xtream and Tillman Fiber are posting triple-digit percentage gains in fiber coverage, signaling rising competitive disruption.
Looking ahead, CostQuest’s Fiber Forecast Model projects between 2.1 million and 6.7 million new fiber BSLs over the next six months.
For providers, policymakers and investors, understanding fiber’s shifting footprint is now essential to navigating the market’s next competitive phase.
Click here to read the full Broadband in America Report: Fiber Optic Market Focus — September 2026 Edition.
1. This data does not reflect CA or IL as they have not yet made it into the broadband funding map data
This report will be updated twice a year when the latest data is released. If you have any questions, please contact [email protected].