
Wondering how broadband coverage changed in the US over the past year?
The most significant change is that unserved locations decreased by 27% while underserved locations increased by 22% from June 2024 (BDC V5) to December 2024 (BDC V6).
To dive deeper into the latest changes in broadband coverage across the US, review the new Broadband in America Report (BBIA)—an ArcGIS StoryMap with interactive charts and map visualizations to easily see the differences between the FCC Broadband Data Collection (BDC) and CostQuest’s Location Fabric version 5 and 6 data.
Then, use the new Time Series Dashboard at the end to examine the changes in broadband availability and technology deployment over the past couple of years using historical coverage data.
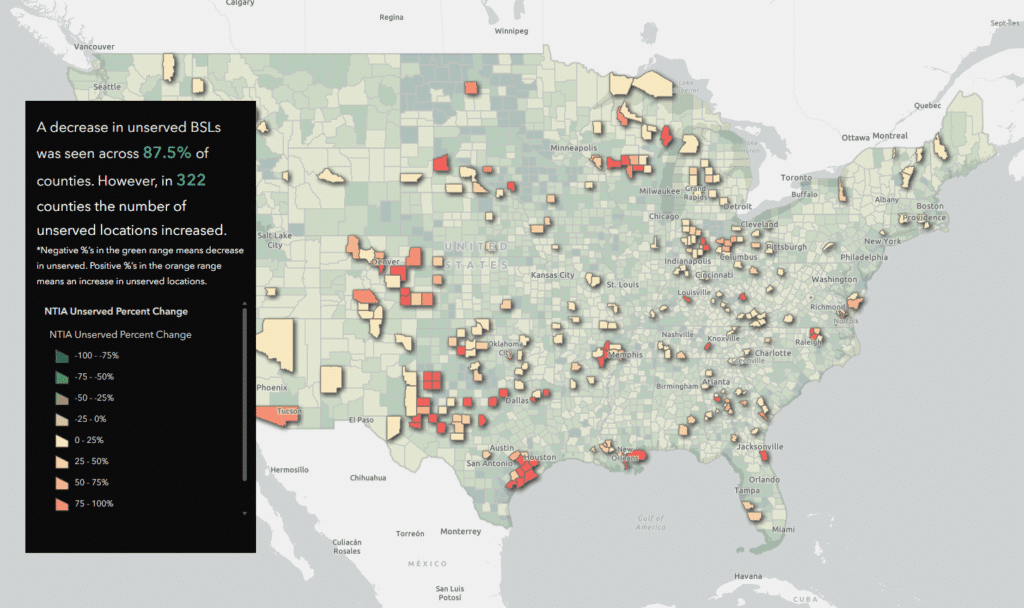
A sample coverage map from the Broadband in America Report.
In the Broadband in America Report, you can visually explore:
- National broadband coverage changes by technology
- Progress on federal broadband deployment funding programs
- Network cost investment (Capex) by population density dynamics from CostQuest’s Network Cost Model data
Scroll through various broadband maps, analyze broadband coverage trends, and dive into the Broadband in America Coverage Report—July 2025 Edition.
About Time Series Dashboard—Historical broadband coverage trends
The Time Series Dashboard consolidates all seven versions of the FCC’s BDC data into a single, time-series visualization platform. This allows for detailed, county-level analysis of broadband deployment trends nationwide. Over this roughly three-year period, the Time Series Dashboard offers insights into changes in broadband coverage, identifies shifts in technology trends, and evaluates the speed of deployment efforts across regions.
The time series historical broadband coverage data, coupled with CostQuest Location Fabric, allows stakeholders to:
- Detect early signs of market saturation or opportunity
- Compare the evolution of infrastructure types over time
- Identify where technology transitions, such as from copper to fiber, are accelerating
- Understand historical deployment patterns that may predict future trends
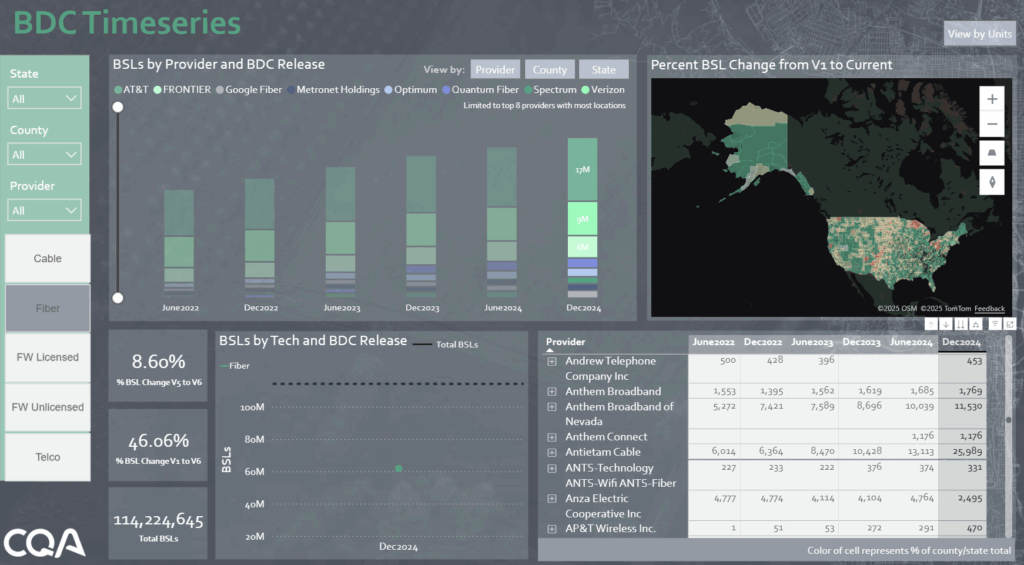
A sample from CostQuest’s Time Series Data Dashboard showing growth in fiber coverage from BDC V5 to V6 data.
In an industry driven by rapid technological advances and shifting policy environments, accessing detailed, time-series broadband data is no longer optional—it is crucial. Analyzing multiple FCC data releases and comparing technological differences provides a powerful perspective on the real-world evolution of broadband access across the country.
The Time Series Dashboard complements the Broadband in America Report by translating national trends into actionable insights at local levels. Together, these resources create a strong toolkit for leaders in today’s fast-changing broadband landscape.
Methodology to measure broadband coverage
The data in the Broadband in America Report and Time Series Dashboard leverages the latest innovations in broadband coverage reporting. It is sourced from the FCC’s BDC data, CostQuest’s Location Fabric, and network cost model data, all of which support federal funding distribution for broadband deployment.
By combining Fabric’s granular geospatial location data with ISP coverage information, this reporting methodology identifies broadband coverage and technology cost trends down to the primary building structure—a substantial improvement over what was previously unavailable in aggregated census block-level reporting. Collectively, this new data enables a more precise and informed approach to strategic decision-making for broadband deployment.
How to access location-level broadband coverage & Location Fabric Data
Visit TrueVerra.io to explore the Broadband Fabric ServiceLandscape Dataset—complete with the latest FCC BDC coverage and Location Fabric Version 6 data available at the county-level, and more.
This report will be updated twice a year when the latest data is released. If you have any questions, please contact [email protected].