
What the latest broadband coverage data tells us about where the country stands today, and where it could go next.
The map of American broadband continues to evolve, county by county, technology by technology, and dollar by dollar. The new Broadband in America Report provides a clear, high-level visual overview of broadband coverage changes across the U.S., using the most recent data available from Versions 6 (December 2024) and 7 (June 2025) of the FCC Broadband Data Collection (BDC), CostQuest’s Location Fabric, and Network Cost Model data.
With 116.4 million Broadband Serviceable Locations (BSLs) identified in Version 7 and 2,142 ISPs reporting broadband service, this report offers an interactive view of national and county-level deployment dynamics from December 2024 to June 2025.
National U.S. broadband coverage snapshot
Between Version 6 and Version 7, the number of served BSLs rose from 109 million to 110.2 million, with an 8.4% reduction in unserved locations. Although 61.9% of counties reduced their unserved BSL counts, 12.3% experienced an increase, indicating persistent pockets of need within the broader U.S. broadband coverage landscape.
Technology-specific coverage trends
The report highlights diverging growth paths by technology. Fiber coverage accelerated, with BSLs served by fiber increasing 8.4% over six months. Licensed Fixed Wireless growth slowed to 5.7%. Cable remained relatively steady between versions. Together, these diverging technology trajectories paint a complex picture of how providers are prioritizing infrastructure decisions across different geographies and market conditions.
Funding-driven expansion and strategic insights
Federal funding is shaping U.S. broadband coverage and driving deployments. Among the 9.8 million federally funded BSLs in non‑BEAD areas, unserved locations fell 6.4%, yet 2.1 million funded BSLs remain unserved or underserved and are still awaiting buildout by current awardees. Nearly half of the remaining funded, unserved, or underserved locations are in RDOF areas. The NTIA’s BEAD program preliminarily added 3.58 million locations to the pool of federally funded BSLs.
Click here to scroll through broadband maps, analyze coverage trends, and dive into the Broadband in America Coverage Report—February 2026 Edition.
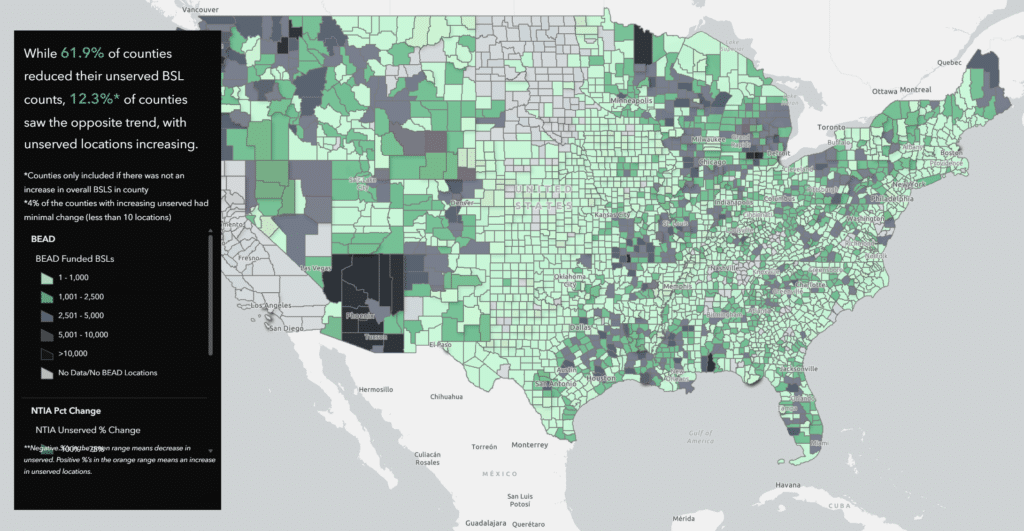
A sample coverage map from the Broadband in America Coverage Report—February 2026 Edition.
This report will be updated twice a year when the latest data is released. If you have any questions, please contact [email protected].