
Analyzing historical broadband data to understand how broadband infrastructure evolves over time is essential for effectively navigating the competitive broadband market. The FCC’s Broadband Data Collection (BDC) datasets offer comprehensive service availability information, but comparing multiple releases across different regions and technologies can be complex.
CostQuest’s new Time Series Data Dashboard makes this easier by bringing all six versions of the FCC BDC data together – the most granular national set of broadband serviceability data – into a single, time-series visualization platform. This dashboard lets you explore county and state level broadband deployment trends across the country.
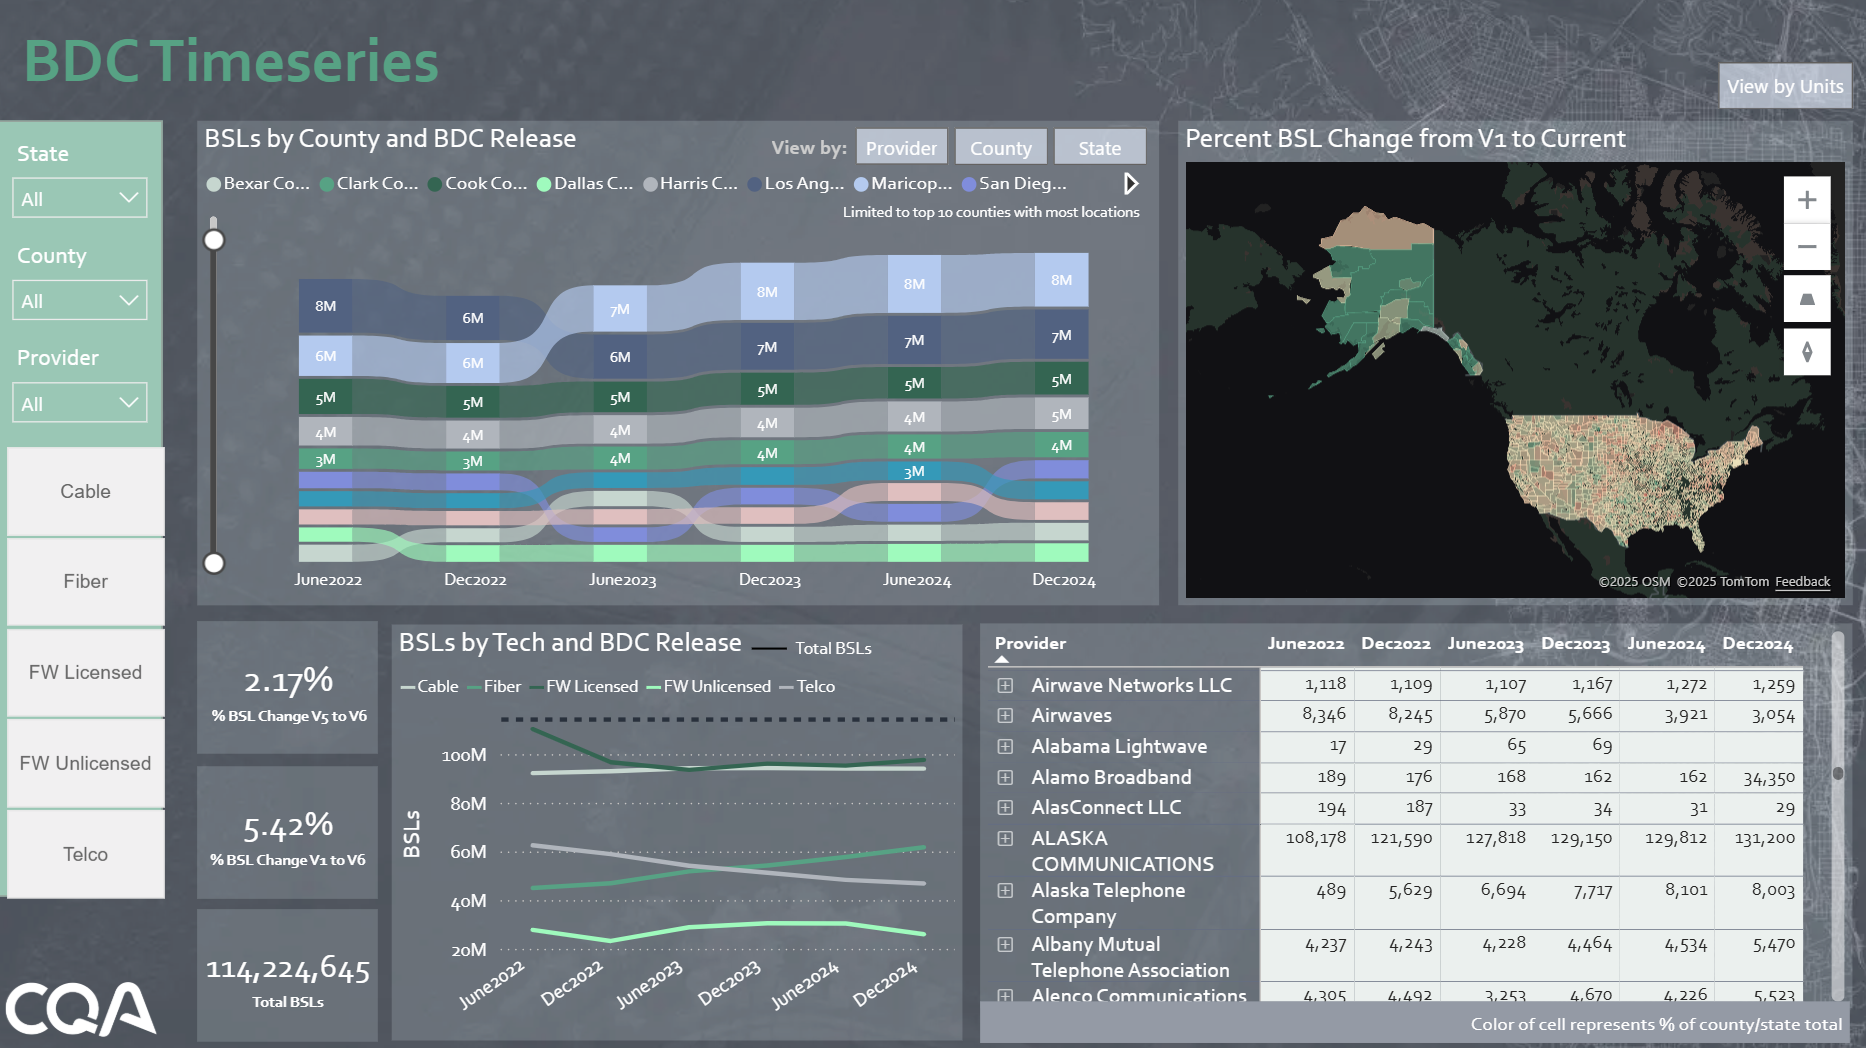
An example of the interactive charts and filters in CostQuest’s Time Series Data Dashboard.
Why Multiple Versions of FCC BDC Historical Broadband Data Matters
Each iteration of the FCC’s BDC dataset highlights updated coverage details and reporting, providing a snapshot of broadband availability at specific points in time. Comparing these versions illustrates important growth patterns, discrepancies, and shifts in infrastructure deployment you wouldn’t see in a single dataset.
Spanning about a three-year period, the Time Series Dashboard offers insights into changes in broadband coverage, by:
- Identifying shifts in technology trends.
- Evaluating the speed of deployment efforts across regions.
- Service provider’s deployment and coverage behavior.
Historical Broadband Data Use Cases
Analyze broadband evolution trends by technology
The Time Series Dashboard available down to the county-level gives a clear overview of broadband availability by breaking it down by technology, such as fiber, copper, cable, fixed wireless, and satellite. These high level insights help identify both the technologies that are growing and where – allowing users to assess trends in broadband deployment, such as fiber overtaking traditional technologies like copper.
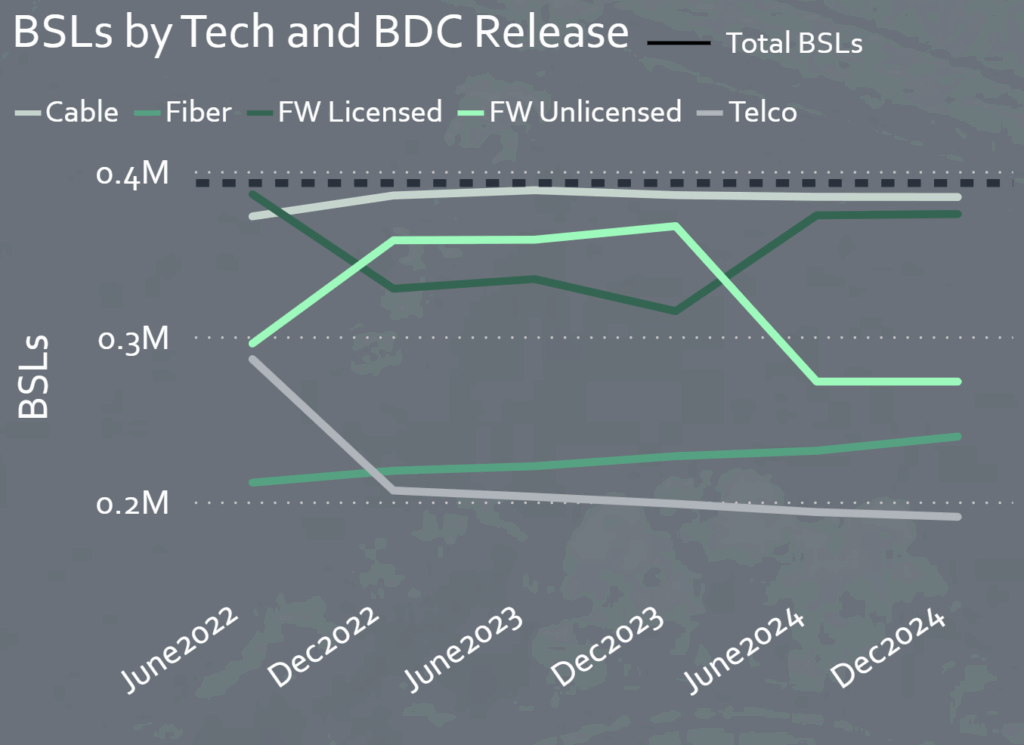
The coverage trends by technology chart in the Time Series Dashboard. Fiber saw a steady coverage increase in this US county from 2022 to 2024, while Unlicensed Fixed Wireless saw a decrease.
Inform competitive market analysis based on provider behavior
BDC data offers detailed insights to support decision-making on resource allocation by understanding both provider and technology deployment behavior over several periods of time. However, broadband availability is rarely consistent across a state or region, and local factors influence the competitive environment. Traditional broadband maps and reports provide a static, often aggregated perspective that can obscure local differences.
In contrast, using CostQuest’s Location Level data allows stakeholders to:
- Detect early signs of market saturation or opportunity.
- Compare the evolution of infrastructure types over time.
- Identify where technology transitions, such as from copper to fiber, are accelerating.
- Understand historical to current provider deployment patterns that may predict future trends.
Investors and service providers can utilize CostQuest’s current and historical location-level broadband data to analyze specific markets, by pinpointing underserved areas or regions experiencing swift growth with a level of detail far beyond counties or census block boundaries. This level of detail helps drive smarter investment choices and more targeted operational strategies, demonstrating the value of incorporating historical broadband data into your analyses to guide decision-making.
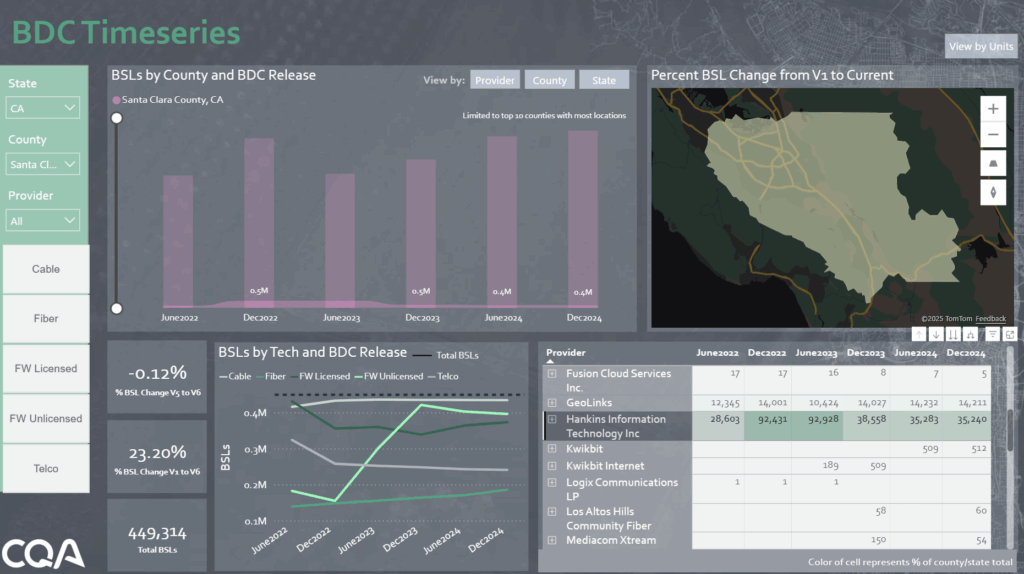
A county-specific view of coverage trends by technology of providers that reported service in Santa Clara County, CA from June 2022 to December 2024.
Build comprehensive understanding of broader broadband industry
The Time Series Dashboard complements broader analyses like the “Broadband in America” report by translating national trends into actionable insights at local levels. Together, these resources create a strong toolkit for leaders to understand the behavior of the broadband industry and target their strategic decisions in today’s fast-changing broadband landscape.
In an industry driven by rapid technological advances and shifting policy environments, accessing detailed, time-series broadband data is no longer optional—it is crucial. The ability to analyze multiple FCC data releases and compare technological differences provides a powerful perspective on the real-world evolution of broadband access across the country.